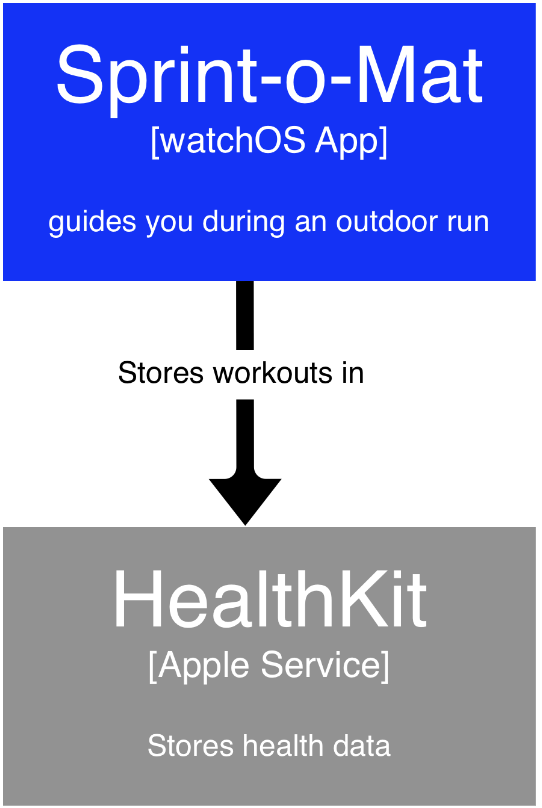
I recently ran into the C4 model for visualizing software architecture. It’s simple and notation agnostic (meaning, you don’t need to learn the meaning of arrow heads).
One of the things I noticed in giving systems interviews is that the interviewee didn’t have any kind of coherent way to visualize their system. So, it was hard to understand what they were saying.
The benefit of C4 is that it’s just slightly more organized than doing nothing. It also asks that you provide a key/legend for any notation choices you make.
I think that most of the benefit comes from the suggestions to use more text. For example:
Boxes have a name, type, and a short description. Think of it like this: NAME is a TYPE that DESCRIPTION.

Arrows form a sentence when read as “BOX A” — “arrow text” –> “BOX B”.

The idea is that the diagrams are stand-alone and are mostly organizing short text snippets.
They are also hierarchical—meaning that if I need more information, there would be possibly be a set of sub-diagrams for each box. Without C4, I think many people would just have the boxes with just the names (titles) and unlabeled arrows.
The metaphor is a map that starts zoomed out and gets more and more detail as you zoom in.
I am mostly suggesting this as a sketching/communication visualization using a whiteboard. But if you are trying to do C4 to keep real diagrams, then generating them from some kind of DSL is much better. PlantUML provides a free solution, and the author of C4 has a freemium solution called Structurizr.