Category Archives: Personal Finance

My Second Lesson in Personal Finance

Last week, I wrote about the first lesson that made a big difference in how I thought about personal finance. Namely, that savings rate is a big driver to outcomes, and that it is very much in your control. Along with that is the binary outcome of whether your savings grow or shrink in retirement and the divergent net worth results you will have as a result of that.

The next big lesson I got was from reading Ramit Sethi’s I Will Teach You to be Rich. By the time I had read this (I was 39), my finances were pretty much in order, and most of the book was more of a reinforcement that I was doing the right thing. It’s also a very entertaining read.

However, I did get one thing—a change in mindset to focussing on income over expenses to increase savings.

Look at the Net Worth spreadsheet. If you set it to a fairly high earner, say 100k to start and a savings rate of 20%, then at 39, they need to save around 28k.

This is aggressive. It would be hard to do much more. If you pay 30% for taxes and 25% for rent, you only have 25% left for everything else. It’s hard to imagine that you could find another 10,000 in savings.

But, finding another $10,000 in income is really not that hard for a programmer.

The book (and his site and blog) give many examples, but simply asking for a raise is probably the simplest and most likely to work. If you get into a habit of renegotiating every year, the combined effect compounds.

His other suggestion is side income. If you are a programmer, there are many ways you could do this. I tried many things over the years. In order of income success:

  1. Advisory consulting on software projects
  2. Programming side-gigs
  3. An Excel add-in
  4. Tutoring/Coaching programmers (I mostly do this for free, but I charged people that could afford it or where their company paid)
  5. Writing a book
  6. Writing for Smashing
  7. Add-ins for niche software (including for a future employer)
  8. iOS Apps (they are all free now, but early App Store was more amenable to paid apps)
  9. iOS Skillshare classes

Over my career, I made significant side income directly from this, which I mostly saved. In addition, many of these things directly altered the course of my career and led to better jobs.

For example, writing apps led to getting a book deal and becoming an iOS programmer with at least some credentials. That helped me get consulting gigs when I did it full-time (or on the side) and was a factor in getting hired by Trello (along with, possibly, the add-ins I made for FogBugz and CityDesk).
The Net Worth Spreadsheet in Vanilla Python

This article is based on the spreadsheet I made to estimate net worth over time.

I think that Excel is basically a programming language, and I have an interest in bridging the gap from it to more traditional languages. And I needed an excuse to get matplotlib working on my machine.

Luckily, procrastination worked in my case. If I had tried it a few months ago, numpy was not yet working on M1 macs, but as of python 3.9.4, it installs normally using pyenv and pip.

I started a GitHub repo to hold the Excel spreadsheet and python port — I’ll be posting more ports to various frameworks. I like it as a simple example because it has conditionals, loops, arrays and is a pretty useful thing to know.

It’s also a good starting point for learning more programming. Excel is great, and there’s a lot you can do, but with the python version, I could add the following features.

  1. Instead of using constants for the various inputs (like market rate), use a lambda and define different ways the market could move rather than constant
  2. Do similar things with spending models in retirement, inflation, etc.
  3. Make it easier to have more lumpy spending/saving — meaning, assume aggressive spending in youth, then a period where you might have children and buying a house, then a house sale in the future, etc.
  4. Make it possible to show many more scenarios at once (like 30 historical market curves effect on your plan)

To be fair, all of this is very possible in Excel. It’s just a lot easier in python.

The Net Worth Spreadsheet Documentation

Yesterday, I posted a spreadsheet to help you explore how savings rate relates to eventual net worth in retirement.

It’s a very simple spreadsheet with a simple model, so I wanted to document it here in case you want to play the formulas.

Here is a description of the inputs and how they are used.

Age/A2: Your age. You can set this to your current age, or a past age if you want to figure out a benchmark

Year/B2: The year associated with the age in A2.

The sheet allows you to compare two scenarios. I1:I8 corresponds to Scenario A (the blue line) and K1:K8 corresponds to Scenario B (the red line)

Starting Net Worth/I2/K2: Your net worth at the age in A2

Market Return/I3/K3: The market return that will be applied to your net worth at the end of each year to determine the starting point for the next year. Obviously, this is simplistic. I recommend keeping this conservative—Use the nominal return (not the return after inflation).

Starting Salary/I4/K4: The gross salary (or income) at your age in A2

Inflation/I5/K5: The rate of inflation to use on expenses after retirement.

Raises/I6/K6: The expected % raise to your salary you will get each year. I set this a little over inflation. It is expected that your expenses and savings increase proportionally such that your saving rate stays constant.

Retirement Age/I7/K7: The age you plan to retire. At this point, you start to draw down against savings. Inflation is applied to the expenses every year. The starting expense amount is estimated based on your savings rate.

Savings Rate/I8/K8: The % of your gross income that you save.

Things this spreadsheet does not try to model:

  • Big expenses like houses and college tuition
  • Increasing expenses because of children
  • Volatile markets
  • Windfalls

Very Simple Net Worth Estimator

Yesterday, I wrote about my first lesson in personal finance where I saw what the effect of savings rate had on retirement outcomes. I focused on the binary result of your net worth growing or shrinking after retirement.

I made a simple spreadsheet if you want to play with this yourself.

Here’s a link to a Google Sheet you can copy.

And here’s an Excel version.

To use it

  1. Put your age in A2
  2. Put your current net worth in I2 and K2
  3. Put your current salary in I4 and K4

I would leave market return, inflation, etc alone and concentrate on seeing the effect of different savings rates. You can see the actual saving amounts in Columns D and F.

Of course, you should not take this as financial advice or even assume these spreadsheets are correct — check the math (let me know if you see an issue).

They are not meant to be accurate models, they are a very simple way of looking at it.

Remember, you can’t really control a lot of the variables on this spreadsheet except saving rate, which you have a lot of control over.

I’ll soon talk about income, which is the other big variable you can control. In this spreadsheet, I have assumed that you get raises slightly more than inflation.

The Day I Learned About Personal Finance

When I was in my early twenties, I got a call from a financial advisor asking if we could have a meeting to discuss my finances. I would say at that point (compared to now) I knew very little, but I did save a lot, maxed out my 401k, and didn’t have any debt. But, aside from the 401k, my money was just in a bank.

I agreed to have coffee with him.

Over the phone he took a bunch of information from me. My age, my salary, my savings, etc, and then at the meeting, he brought a small spiral bound book with a personalized plan.

I can tell you right now, that that plan was probably not good. He, almost certainly, was not a fiduciary, and the mutual funds he wanted to put me in probably had high fees.

One page of that book, though, changed my life.

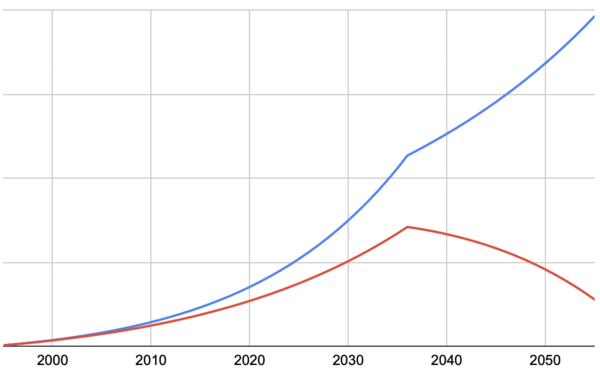
It was a line graph. The x-axis went from 1995 to 2055 or age 25 to 85. The y-value was my predicted net-worth. This was the result of using my expected salary growth, my savings rate, expense growth, my current net worth, inflation guesses, expected return, etc. You can find many such calculators on the web or do it yourself in Excel.

It was as you would imagine, an exponential growth curve that results from compound interest as long as returns and savings grow with respect to expenses and inflation.

The part that surprised me was that at 2035, when I would turn 65 and presumably retire, the curve had a noticeable notch, but still basically grew, but on a different exponential curve.

I asked how it could still go up after I retire, and he explained that at that point my investments would make more each year than I needed to spend, so they would keep growing.

I recreated the shape here.

In my mind, the red line was what I was going for—it’s not a bad outcome. He showed me that the blue line was not only possible, but actually, I was already headed there if I kept my savings rate. Most of the assumptions were fairly conservative. The only difference between those lines is expense growth (or, in other words, savings growth).

I honestly didn’t hear anything else he said that day. Look at what a difference it makes.

Assuming that you are not a stock-picking genius (spoiler alert: you’re not), and you are getting market returns from index funds, the only variable you control is savings rate. Of course, there are several components of savings rate, which I’ll talk about soon.