This is part of a series called Eight Questions to Ask About Your Tech Debt
- Introduction
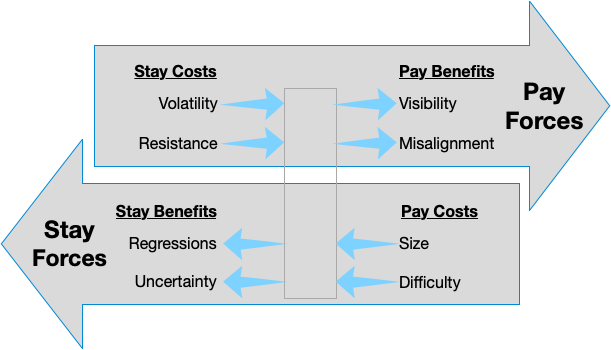
- #1: Visibility, #2: Misalignment, #3: Size, #4: Difficulty, #5: Volatility, #6: Resistance, #7: Regressions, #8: Uncertainty
- Using the Eight Questions
- Planning with the Eight Questions, Part 1 & Part 2
The main thing to keep in mind is this diagram (described in the introduction):
In the past two emails, we considered projects with a net force near 0. For them, we started with projects that decreased their staying forces first.
Now let’s consider a tech debt project with a net negative force.
At Trello, we had an offline sync system that I had suspected was not as reliable as we would like (based on Support Cases). We had inadequate observability to understand how bad it was, or what problems it had. I would have scored it like this:
1. Visibility: If this debt were paid, how visible would it be outside of engineering?
Score: 2 – Sync was working almost all of the time (we later figured out it was 99.8% working)
2. Misalignment: If this debt were paid, how much more would our code match our engineering values?
Score: 0 – The code was in Objective-C, but that was still ok according to our guides
3. Size: If we knew exactly what to do and there were no coding unknowns at all, how long would the tech debt fix take?
Score: 2 – It was probably going to be spot fixes of edge cases
4. Difficulty: What is the risk that work on the debt takes longer than represented in the Size score because we won’t know how to do it?
Score: 3 – We were not 100% sure what the problems were
5. Volatility: How likely is the code to need changes in the near future because of new planned features or high-priority bugs?
Score: 1 – the code rarely changed
6. Resistance: How hard is it to change this code if we don’t pay the debt?
Score: 1 – the code was complex because the problem was complex, not because of debt
7. Regression: How bad would it be if we introduced new bugs in this code when we try to fix its tech debt?
Score: 5 – All updates went through the sync system, even when online (they just synced faster)
8. Uncertainty: How sure are we that our tech debt fix will deliver the developer productivity benefits we expect?
Score: 5 – We didn’t have a plan because we didn’t know what was wrong, so I always score that as a 5.
That results in a net force of -3.35, which is on a scale from 0 to -5 (in the Staying direction). But, sometimes you have no choice, and in 2019, our CTO ordered all teams to stop feature work and fix reliability problems in our apps. I was given free reign, and I decided to work on this problem.
Here is what I did (but, honestly, I didn’t have this framework when I did, I just winged it):
- First, I put in Observability (which is how I knew that reliability was 99.8%). But, we had millions of users and requests. That was a lot of errors per day. This meant my Visibility was under-scored. The risk of Regressions was also reduced by the observability.
- The observability also aggregated the worst offender errors (usually an HTTP 400 Bad Request caused by a bug), which were easy to fix, reducing Size.
- Being ordered to change the code by the CTO meant that Volatility was much higher too.
- Our PM and EM agreed that 99.8 was unacceptable, which meant that Misalignment was off too (from an internal values perspective)
- We found that most of the issues were edge-cases on our API and its error conditions (so, sometimes, a retry was able to address the problem). This reduced Uncertainty a bit.
In reality, this was something that was paid off in small increments over time. Eventually, we reduced the number of errors to 25% of its former level.
Next: Bonus Question: Joy